
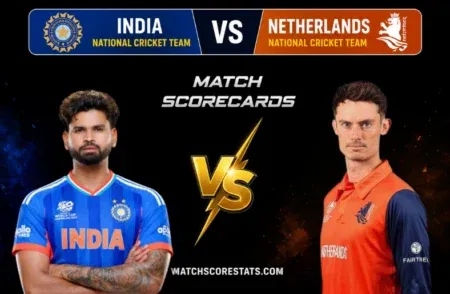
Cricket has always been a game filled with numbers, small moments, and important decisions. Many people enjoy watching matches without paying much attention to the statistics, yet the numbers often explain everything that happened on the field. A scorecard is not only a list of runs and wickets. It is a complete summary that helps fans, players, coaches, and even journalists understand the match better. Reading one may look confusing at first, although it becomes surprisingly simple after learning the basic parts. Every match leaves behind a record, and that record is often more valuable than quick highlights shown after the game ends.
Basic Scorecard Meaning
A Cricket Scorecard presents every important detail from a match in one organized place. It normally includes team totals, batting figures, bowling statistics, fall of wickets, extras, partnerships, and match results. Every section adds useful information without requiring someone to watch every ball.
Batting details usually begin with player names followed by dismissal methods and total runs scored. The number of balls faced also appears because quick scoring and slow scoring create different situations during an innings. Boundaries are listed as fours and sixes, helping readers understand how a batter built the innings. Strike rate becomes another useful number in limited-overs cricket because it measures scoring speed instead of only total runs.
A simple glance at batting numbers can reveal whether an innings depended on one player or several consistent contributions. That makes the scorecard valuable long after the match has finished.
Batting Numbers Explained
Many beginners only notice the runs beside every batter’s name. Those runs matter, but several other numbers tell a much deeper story about the innings. Balls faced, boundaries, and strike rate together explain how the batter approached different stages of the game.
A player scoring sixty runs from forty deliveries probably attacked throughout the innings. Another batter making the same score from ninety balls may have focused on stability instead. Neither approach automatically becomes correct because match situations change constantly.
Dismissal methods also provide useful information. Being caught, bowled, run out, or trapped leg before wicket each tells something about how the wicket fell. Coaches often study these patterns while preparing players for future matches.
Partnerships deserve attention too. Cricket remains a team game, and successful partnerships frequently decide close contests more than individual performances alone.
Bowling Figures Matter
Bowling statistics reveal much more than wickets collected during the innings. Economy rate, overs bowled, maiden overs, and total runs conceded all contribute to the complete picture.
A bowler taking only one wicket while conceding very few runs may influence the match more than another bowler claiming three expensive wickets. Pressure created during quiet overs often forces mistakes later against different bowlers.
Maiden overs remain especially valuable in longer formats because they increase pressure on batters. Dot balls gradually create frustration, encouraging risky shots that produce wickets.
Modern cricket analysts regularly compare bowling performances using economy rates alongside strike rates. Looking at both numbers provides a balanced understanding instead of relying only on wicket totals.
Extras Change Matches
Extras sometimes receive little attention, although they can become match-changing contributions. Wide balls, no balls, byes, and leg byes all increase the batting team’s score without being credited to individual batters.
No balls become particularly costly because they usually provide an extra delivery along with a free hit in many limited-over competitions. A single careless mistake may produce several additional runs.
Wide deliveries often reflect poor bowling accuracy, while byes sometimes highlight fielding or wicketkeeping challenges instead of bowling problems. Every extra appears separately because analysts want to identify exactly where unnecessary runs originated.
Teams consistently reducing extras generally perform better across long tournaments because disciplined cricket limits free scoring opportunities.
Fall Of Wickets
The fall of wickets section records exactly when every batter was dismissed during the innings. This information may appear small, although it explains momentum shifts remarkably well.
Imagine a team reaching one hundred runs without losing a wicket before suddenly collapsing to one hundred twenty for five. That dramatic change immediately becomes visible through wicket timings alone.
Strong middle-order recoveries also stand out clearly after examining wicket progression. Coaches frequently revisit these moments while reviewing performances because turning points shape future planning.
Fans who missed live action can still understand important phases simply by studying wicket sequences and partnership lengths.
Match Situation Reading
Understanding context remains just as important as reading raw statistics. Two identical batting scores may carry completely different meanings depending on pitch conditions, opposition strength, weather, and match format.
Scoring two hundred fifty runs on a difficult surface could represent an outstanding effort. The same total might disappoint supporters on an excellent batting pitch where teams usually exceed three hundred.
Weather interruptions also influence scorecards because revised targets sometimes appear through special calculations. Readers should notice whether shortened matches affected final results before comparing performances directly.
Context transforms statistics into meaningful information instead of isolated numbers without explanation.
Digital Scorecards Today
Technology has completely changed how supporters follow cricket around the world. Printed newspapers once provided detailed scorecards the following morning. Today, live updates arrive ball by ball within seconds.
Most cricket websites and mobile applications refresh automatically after every delivery. Fans receive current batting figures, bowling analysis, partnership records, projected scores, and wagon wheels almost instantly.
Interactive graphics make information easier to understand without replacing traditional scorecards entirely. Many experienced followers still prefer standard statistical tables because they present every important detail together.
Digital access has made cricket analysis faster, broader, and much more convenient for supporters everywhere.
Useful Statistics Included
Modern scorecards often contain advanced statistics beyond traditional batting and bowling numbers. These additional details help serious followers evaluate performances with greater accuracy.
Batting strike rates, bowling strike rates, dot-ball percentages, boundary frequencies, and partnership breakdowns create deeper understanding. Some competitions even include fielding contributions such as catches, run-outs, and stumpings within player summaries.
Analysts combine multiple statistics before forming opinions because single numbers rarely explain complete performances. Balanced evaluation remains far more reliable than focusing on only one impressive figure.
Statistical comparisons across tournaments also become easier when consistent formats remain available throughout different competitions.
Why Fans Use Scorecards
Supporters often revisit scorecards long after memorable matches have ended. Numbers preserve important sporting moments even when memories gradually fade over time.
Fantasy cricket players regularly examine player statistics before selecting teams. Journalists depend upon scorecards while writing detailed match reports. Coaches review performances during training sessions, and commentators reference historical numbers throughout live broadcasts.
Even casual fans benefit because scorecards quickly answer common questions regarding top scorers, best bowlers, partnerships, and overall match flow.
Learning to read every section requires only a little practice before the information becomes easy to understand.
Comparing Different Formats
Test cricket, One Day Internationals, and Twenty20 matches all use scorecards with similar structures. The differences mainly appear through playing style and statistical emphasis.
Test matches often highlight patience, long partnerships, and sustained bowling spells. Limited-over cricket places greater attention on strike rates, economy rates, powerplay performances, and finishing ability.
Readers should avoid comparing performances across formats without understanding these differences. A batting average that appears excellent in one format may seem ordinary elsewhere because every version of cricket rewards different skills.
The Cricket Scorecard therefore becomes a flexible record capable of explaining every format using familiar statistical categories.
Common Reading Mistakes
Many beginners assume higher run totals always indicate better performances. That idea often creates incorrect conclusions because match conditions vary greatly.
Ignoring economy rates, partnerships, extras, or wicket timings removes valuable context. Reading only batting scores also overlooks outstanding bowling displays that may have decided the contest.
Another common mistake involves comparing players without considering opposition quality. Statistics become much more meaningful after understanding who performed, where they played, and under what conditions.
Developing good habits while reading scorecards improves overall cricket knowledge remarkably quickly.
Conclusion
A cricket scorecard remains one of the simplest yet most valuable records created after every match finishes. matchscorestats.com offers cricket lovers another place to explore match statistics, player performances, and detailed information in an easy-to-read format. Learning how every section works helps fans appreciate the sport beyond boundaries and wickets alone. Whether following local tournaments or international championships, understanding statistics makes every game more enjoyable and informative. Keep exploring scorecards regularly, compare performances carefully, and continue building your cricket knowledge with reliable information every season.
Read also :-
england national football team vs senegal national football team lineups